- Home
- Artificial Turf Industry Map
Turf Industry Knowledge Graph
Artificial Turf Industry Map
Artificial turf is supported by a network of manufacturers, suppliers, installers, products, and applications.
This page provides a visual guide to the structure of the artificial turf industry.
Each diagram explains a different part of the industry including company types, supply chains, products, and applications.
INDUSTRY OVERVIEW
Explore the Structure of the Turf Industry
The artificial turf industry includes manufacturers, suppliers, installers, products, and applications working together to complete turf projects.
Use the sections below to explore each layer of the industry and see how these components connect.
Each section includes a visual diagram explaining how that part of the industry works.
(Click or tap an icon to jump to the section)
Industry Structure
How the Artificial Turf Industry Is Organized
Artificial turf projects are the result of multiple entities working together across manufacturing, distribution, installation, and project execution.
At the top of the industry are manufacturers that design and produce turf systems. These products move through suppliers and distributors, who make materials available to contractors and installers across regional markets.
Installers then complete projects for property owners using those materials, applying them to a wide range of residential, commercial, and recreational environments.
Understanding this structure is important because the turf industry is not defined by a single type of company. It operates through a network of companies, products, applications, and locations working together.
The diagram illustrates these core structural layers and how they connect to form real-world turf projects.
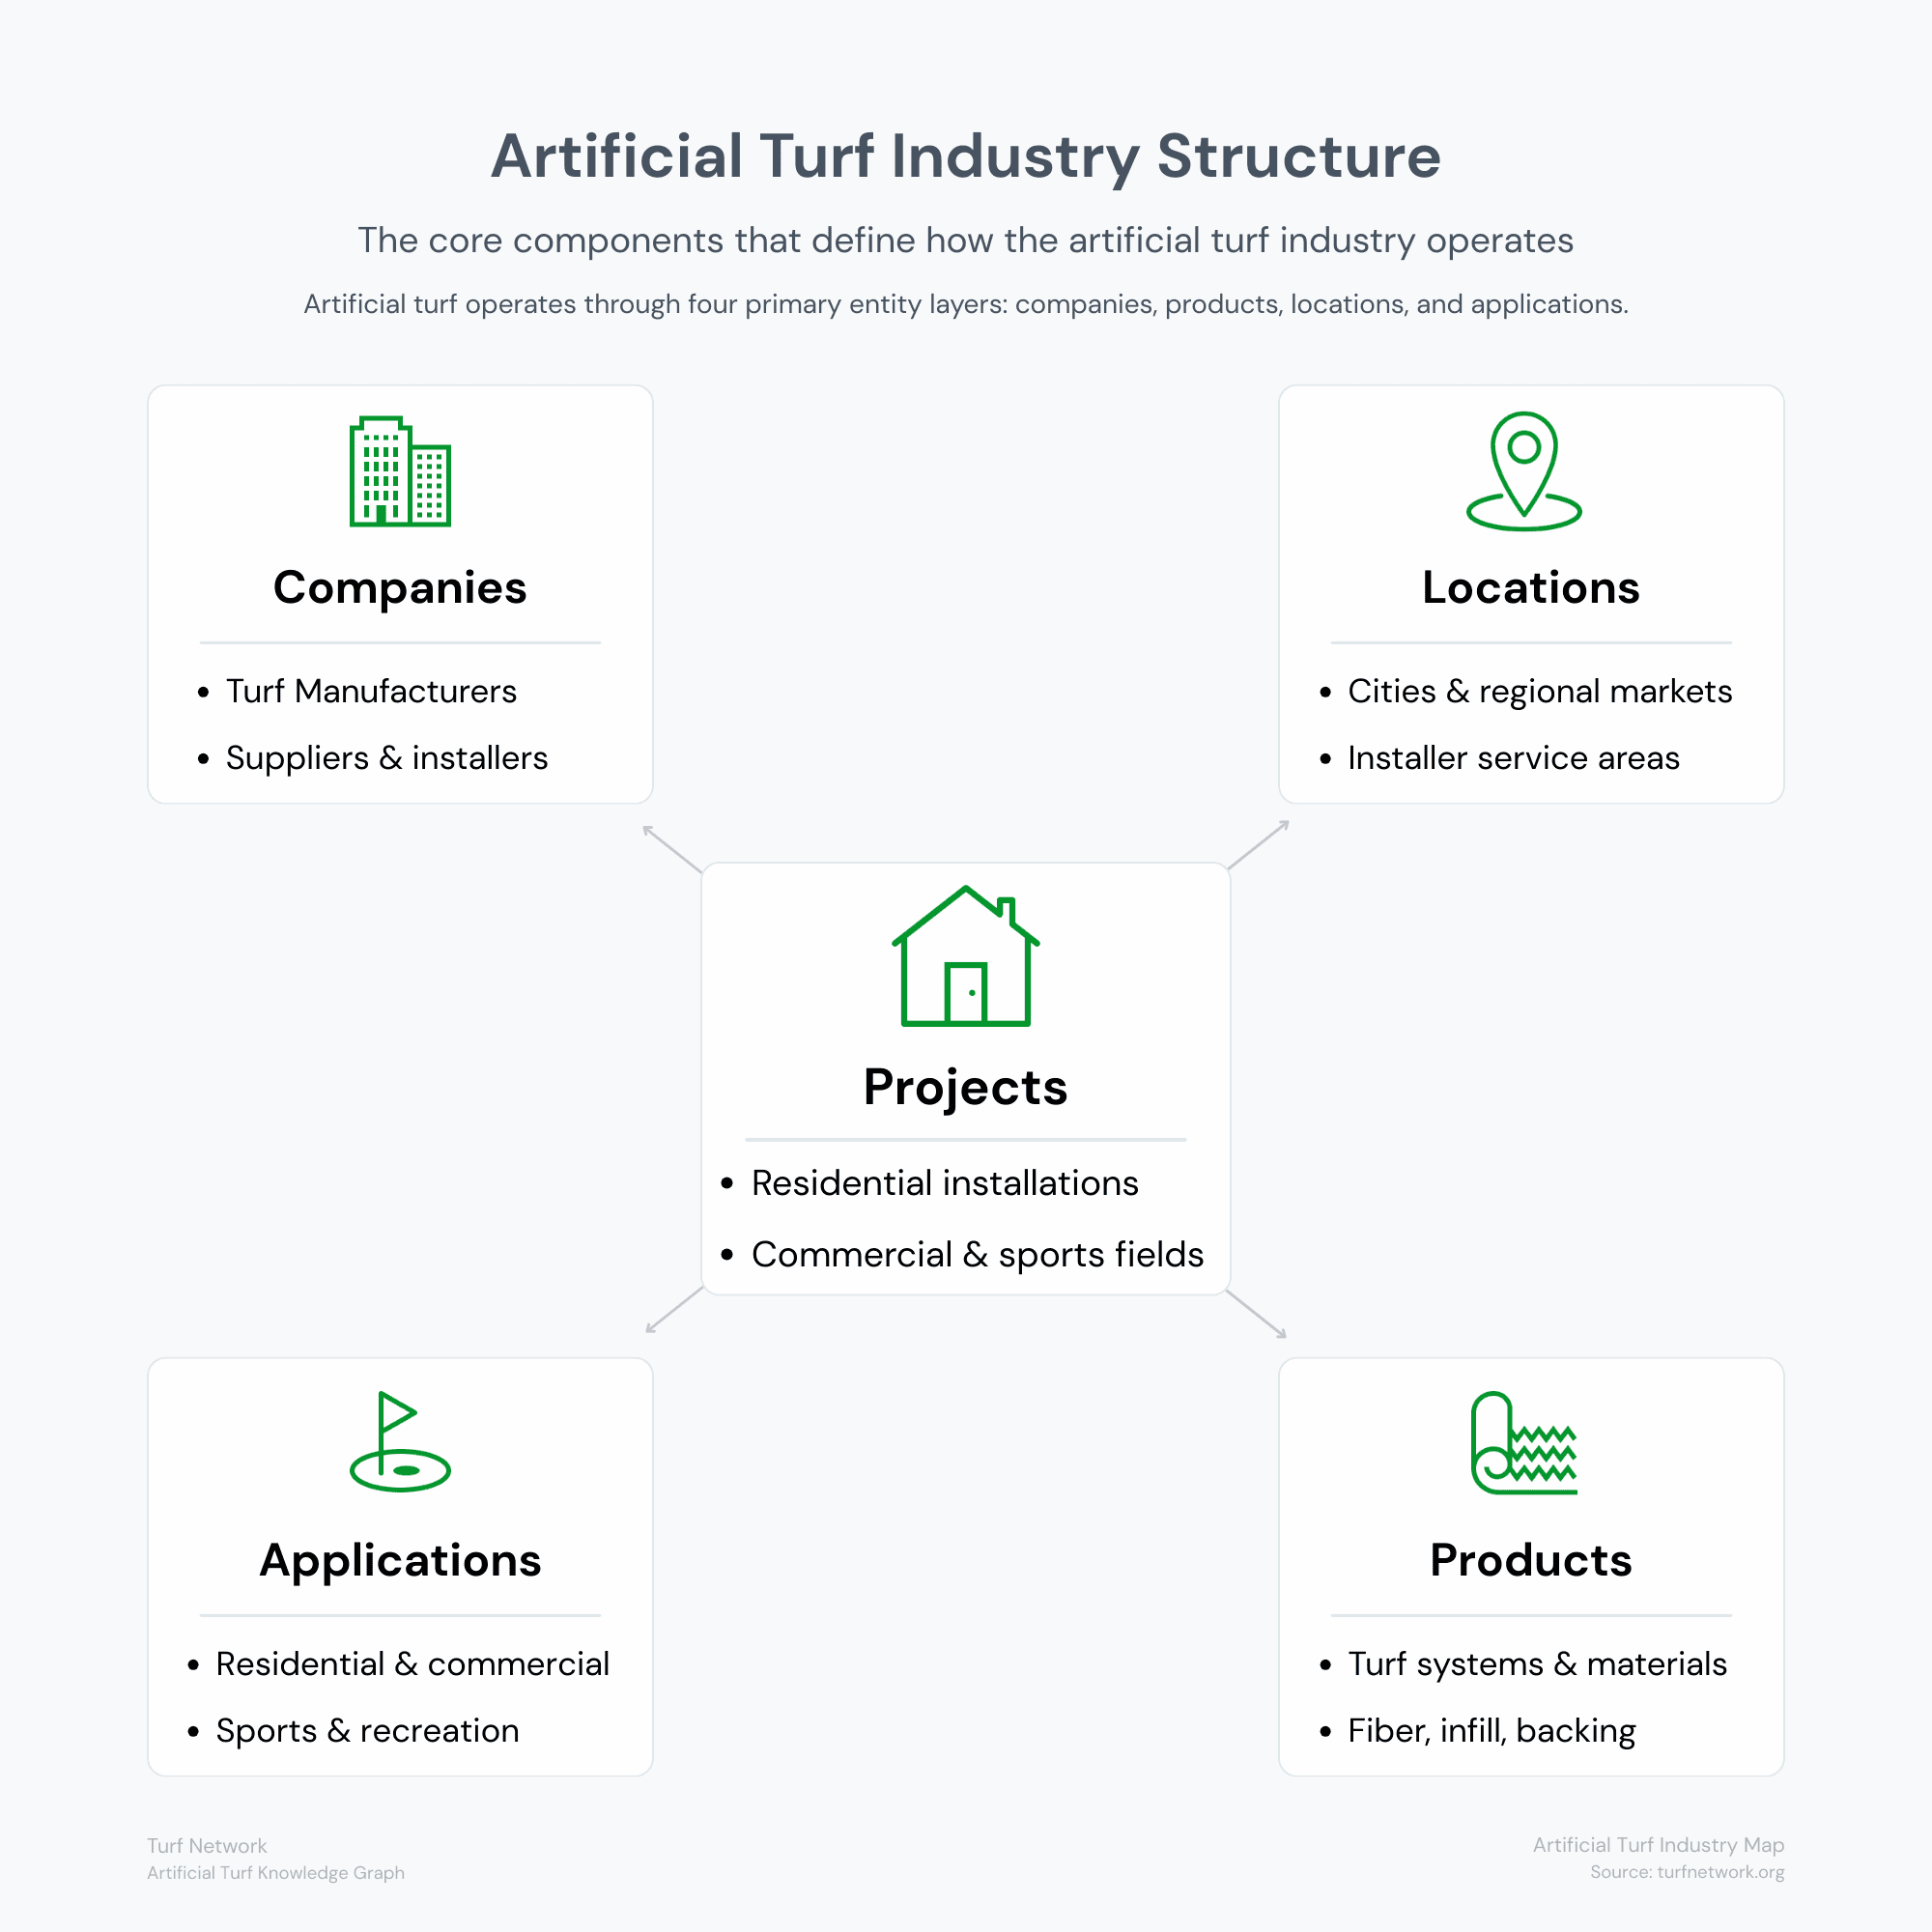
The artificial turf industry includes manufacturers, suppliers, installers, and project owners connected through product distribution and installation relationships.
Turf Network — Artificial Turf Industry Map
Source: Turf Network – turfnetwork.org/artificial-turf-industry-map/
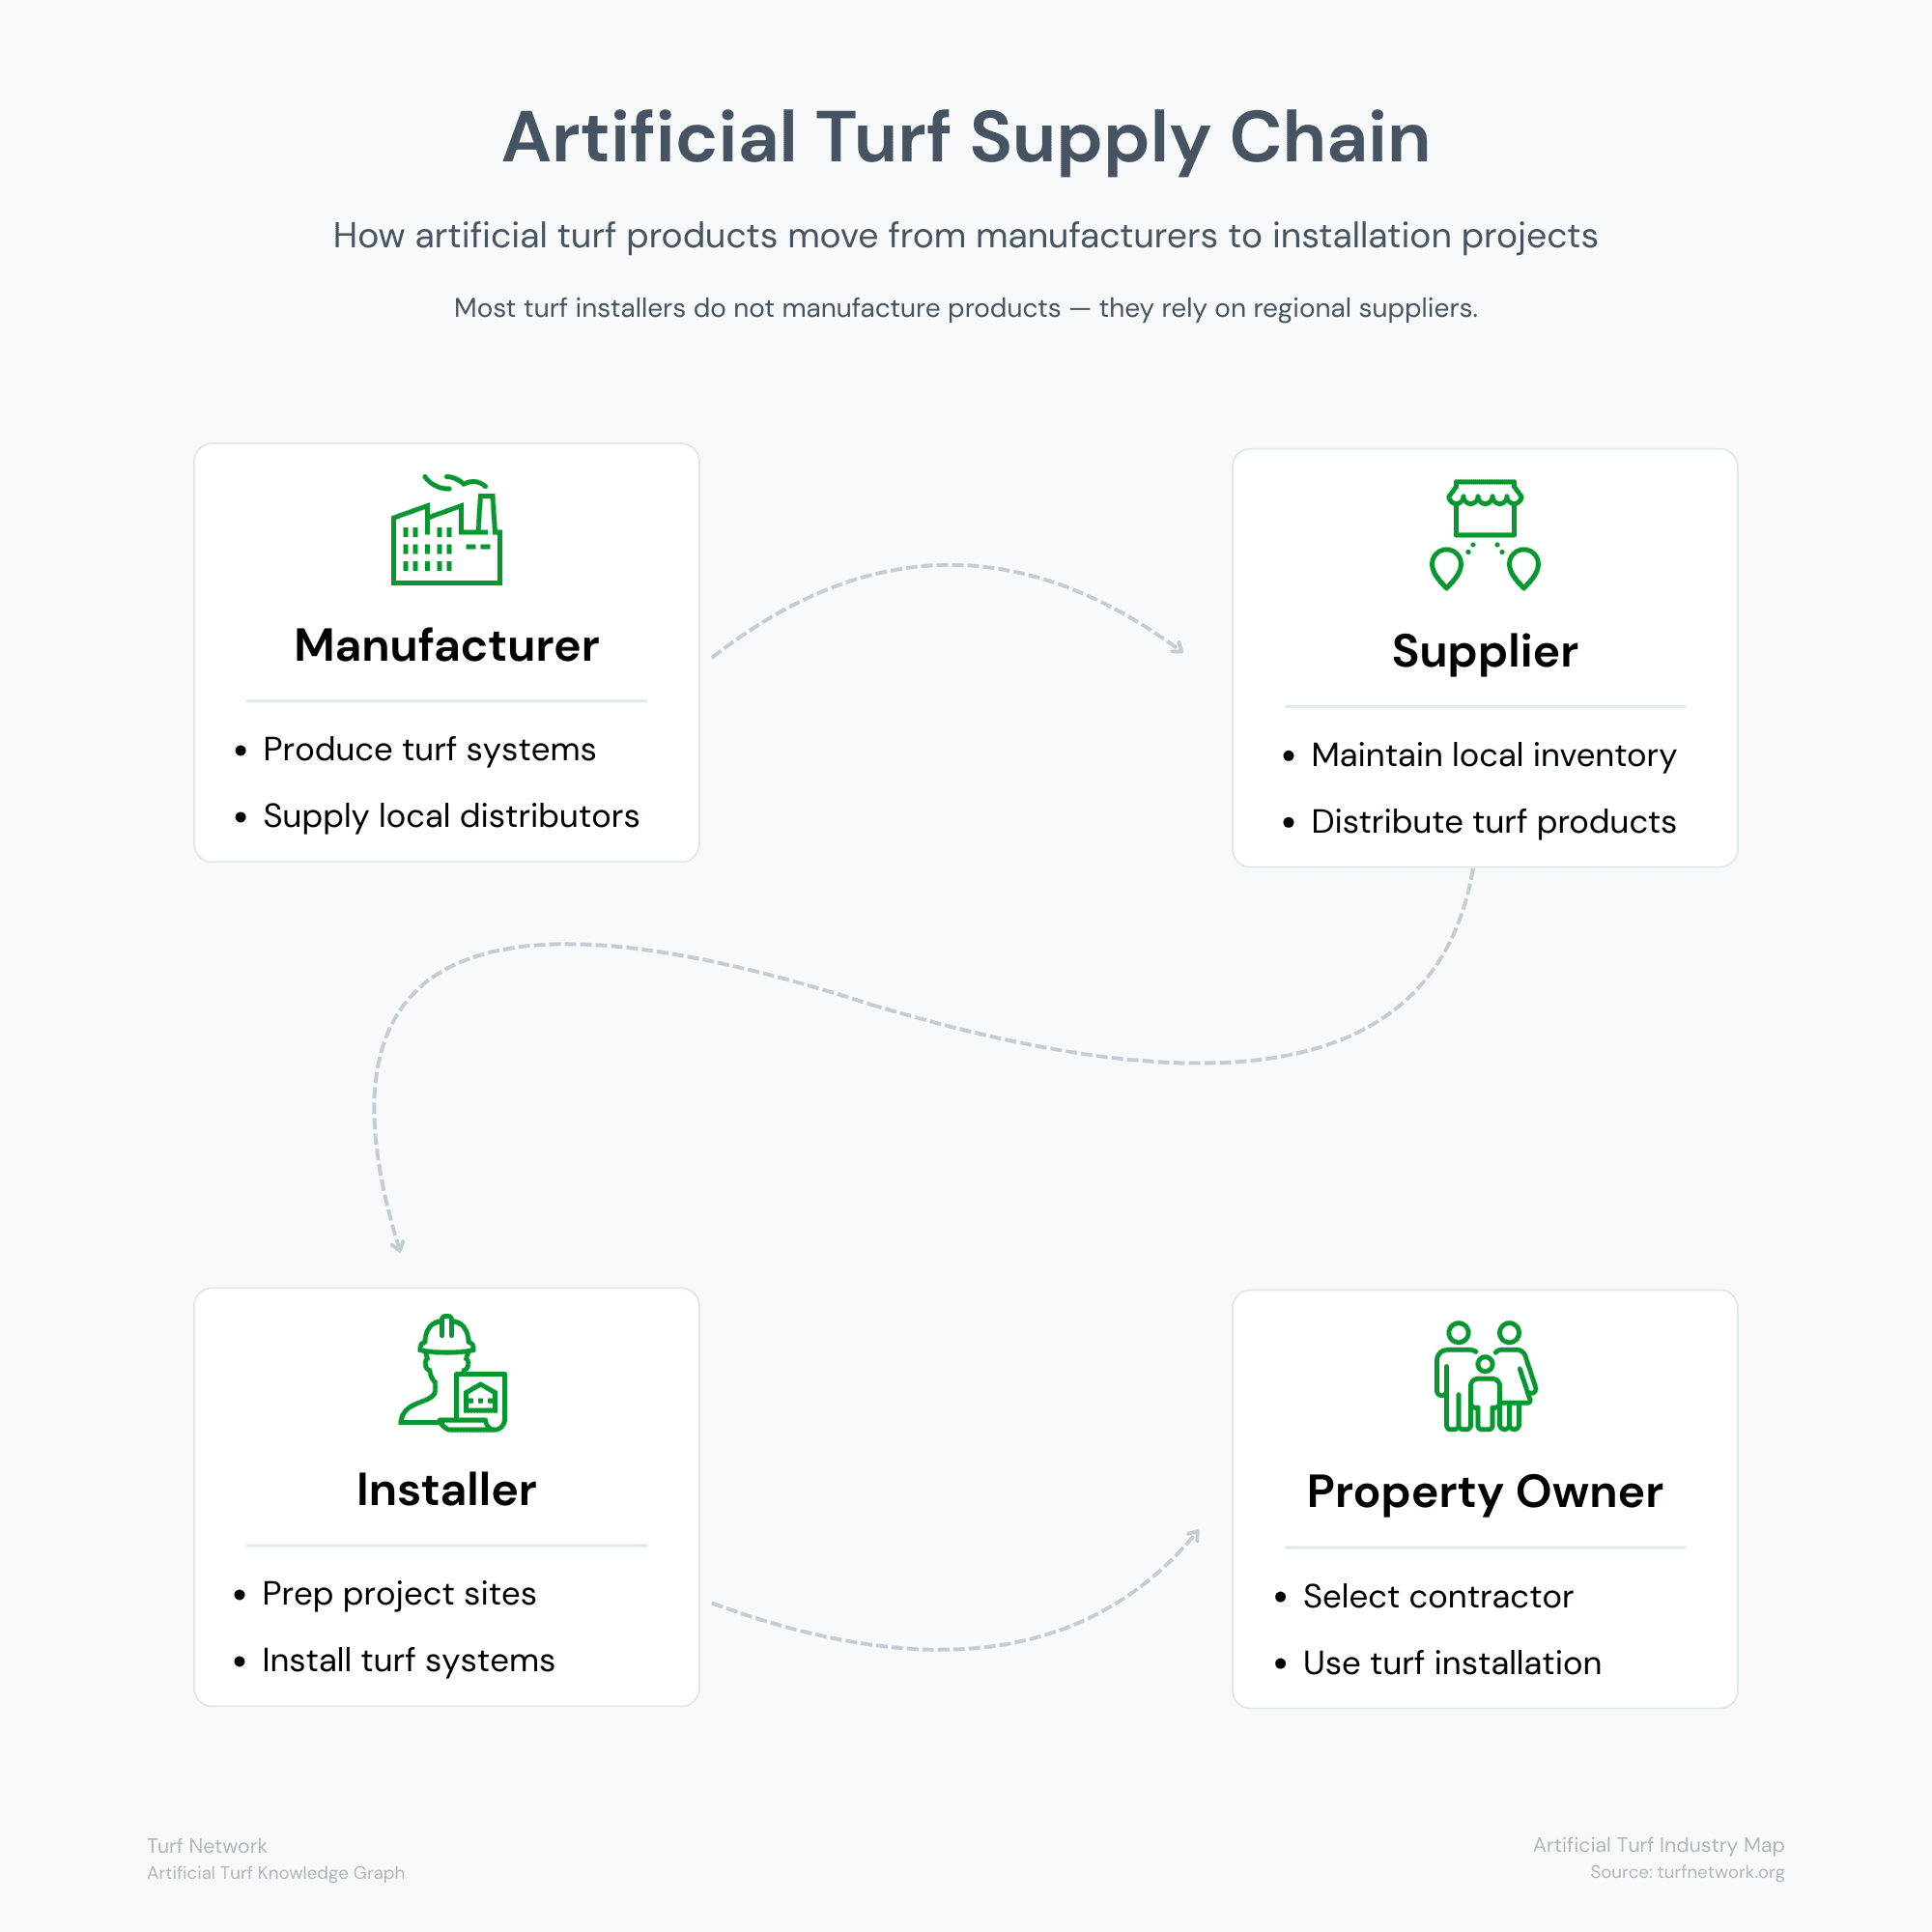
Artificial turf supply chain diagram showing flow from manufacturers to suppliers, installers, and property owners.
Turf Network — Artificial Turf Industry Map
Industry Supply Chain
How Artificial Turf Moves Through the Supply Chain
Artificial turf products follow a defined path from manufacturing to installation.
Manufacturers produce turf systems and related components such as fibers, backing materials, and infill products.
These materials typically move through regional distributors and suppliers, who store inventory and make products available to installers and contractors.
Installers then purchase materials, transport them to job sites, and complete the installation process for residential, commercial, or recreational properties.
While some companies operate across multiple parts of the supply chain, most businesses specialize in one role—manufacturing, supplying, or installing.
The diagram shows how turf products move through these distribution stages before becoming completed projects.
Applications
Where Artificial Turf is Used
Artificial turf is used across a wide range of environments, from private residential spaces to large-scale commercial facilities. Residential installations commonly include lawns, pet areas, kids’ play areas, rooftop spaces, and backyard putting greens. These projects typically focus on durability, drainage, and aesthetic appearance.
Commercial applications are often larger and more specialized. These include sports fields, schools, public parks, hospitality environments, and event spaces, where turf is used for durability, safety, and long-term maintenance efficiency.
Different applications require different turf products, base systems, and installation methods. The diagrams below illustrate how residential and commercial uses represent two major segments of the broader artificial turf market.
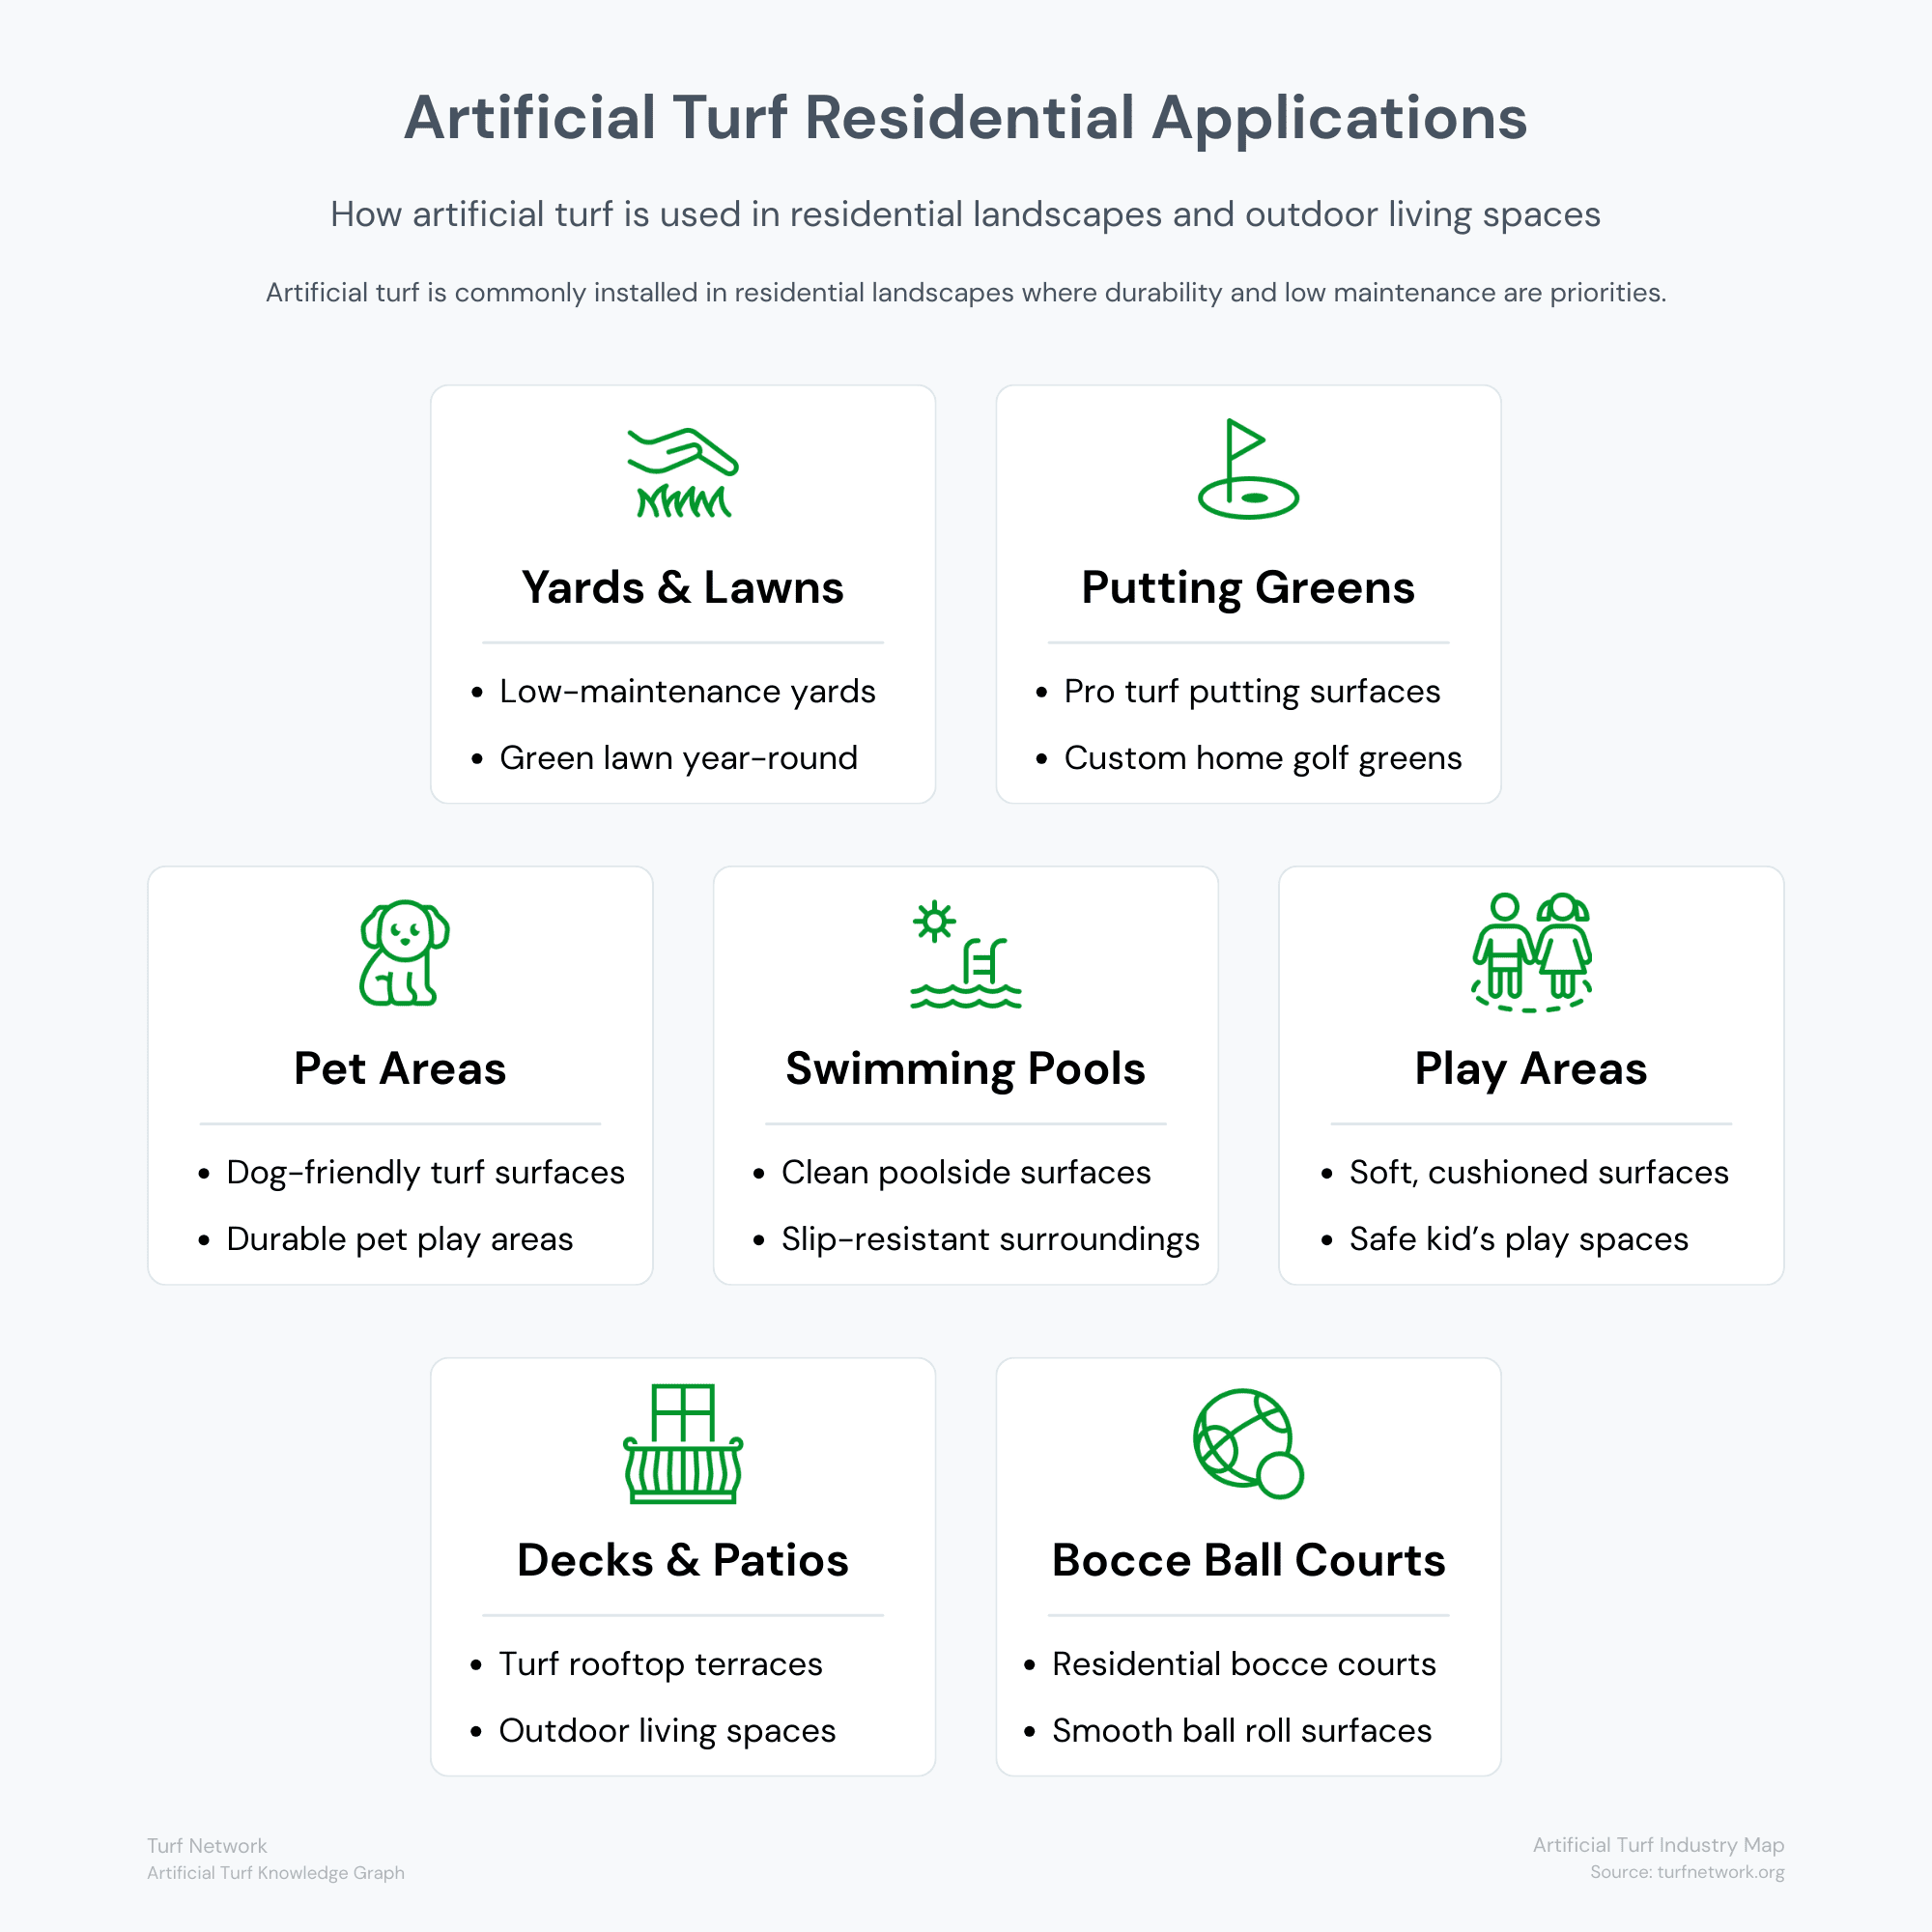
Artificial turf is commonly installed in residential landscapes for lawns, pet areas, putting greens, pool surroundings, patios, and recreational spaces.
Turf Network — Artificial Turf Industry Map
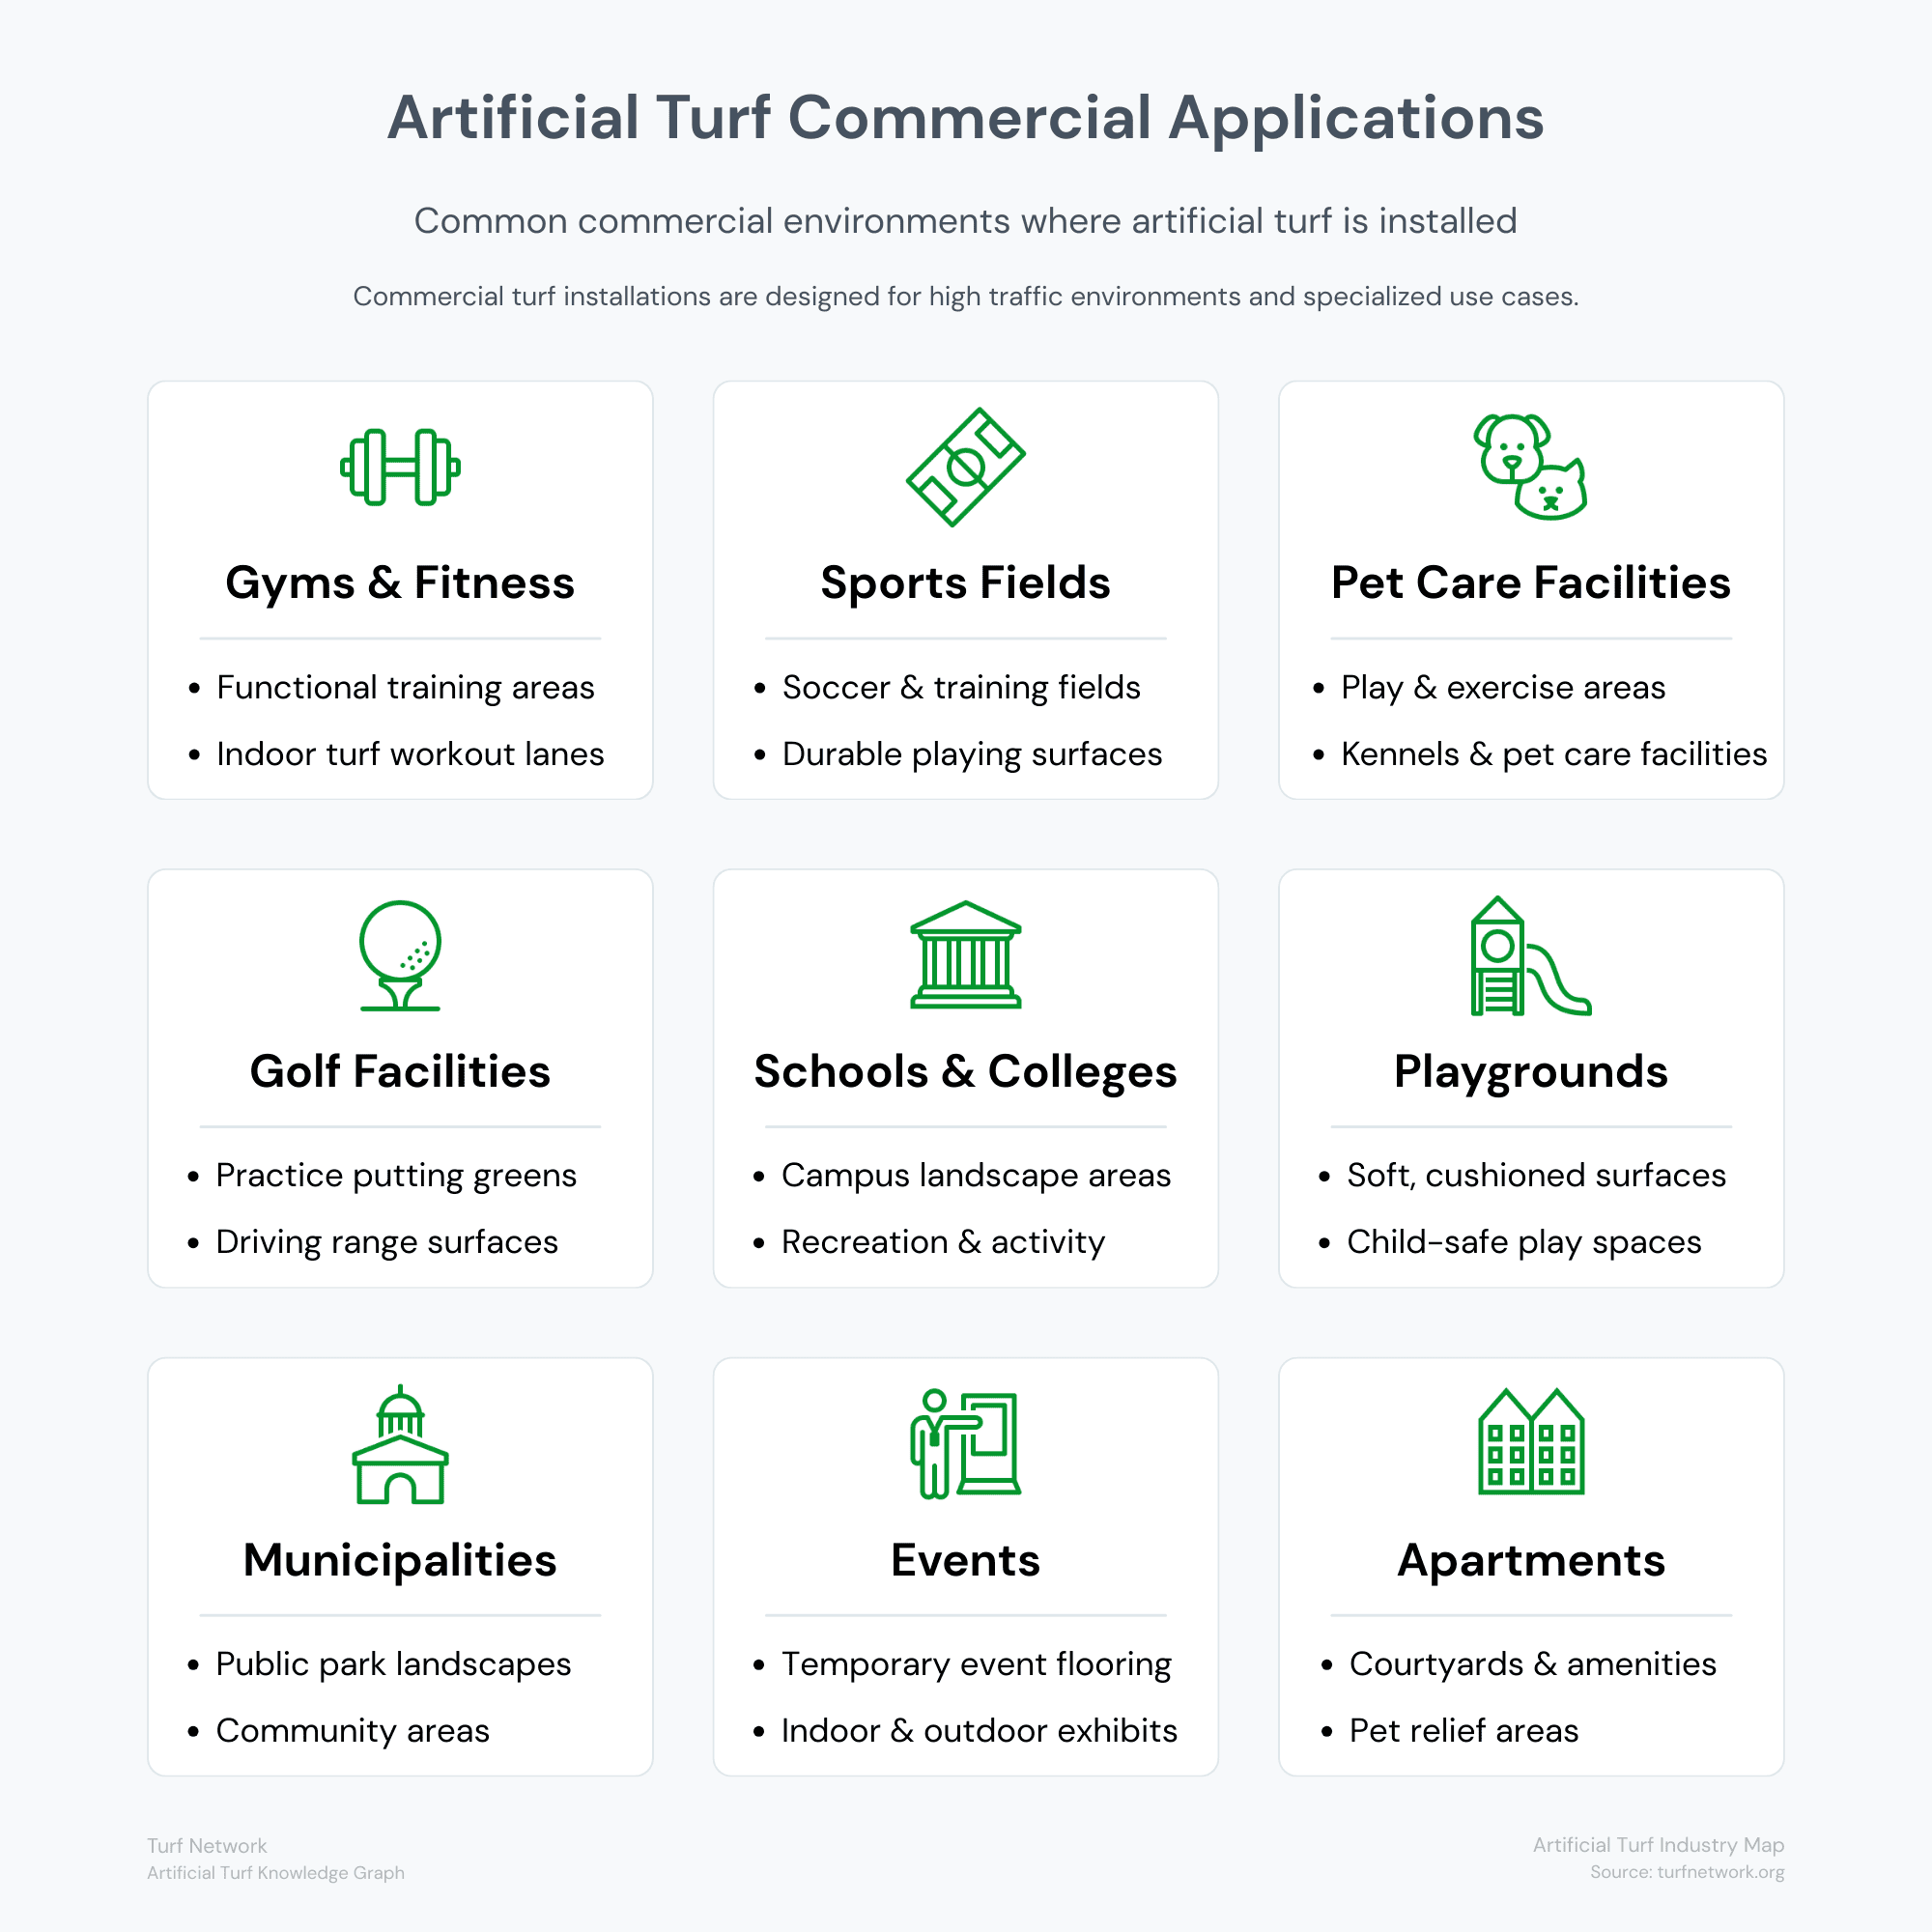
Artificial turf is widely used in commercial environments including sports facilities, schools, parks, gyms, apartments, and event venues.
Turf Network — Artificial Turf Industry Map
Industry Entities
Companies That Operate Within the Turf Industry
The artificial turf industry includes several types of companies, each responsible for a different part of the ecosystem.
- Manufacturers design and produce turf systems and related components.
- Suppliers and distributors manage inventory and make products available across regional markets.
- Installers and contractors handle site preparation, base construction, and final turf installation for property owners.
Some companies operate in more than one role.
For example, a distributor may also provide installation services, or a manufacturer may sell directly through a dealer network.
Understanding these company types helps clarify how projects are delivered and how businesses relate to each other within the industry.
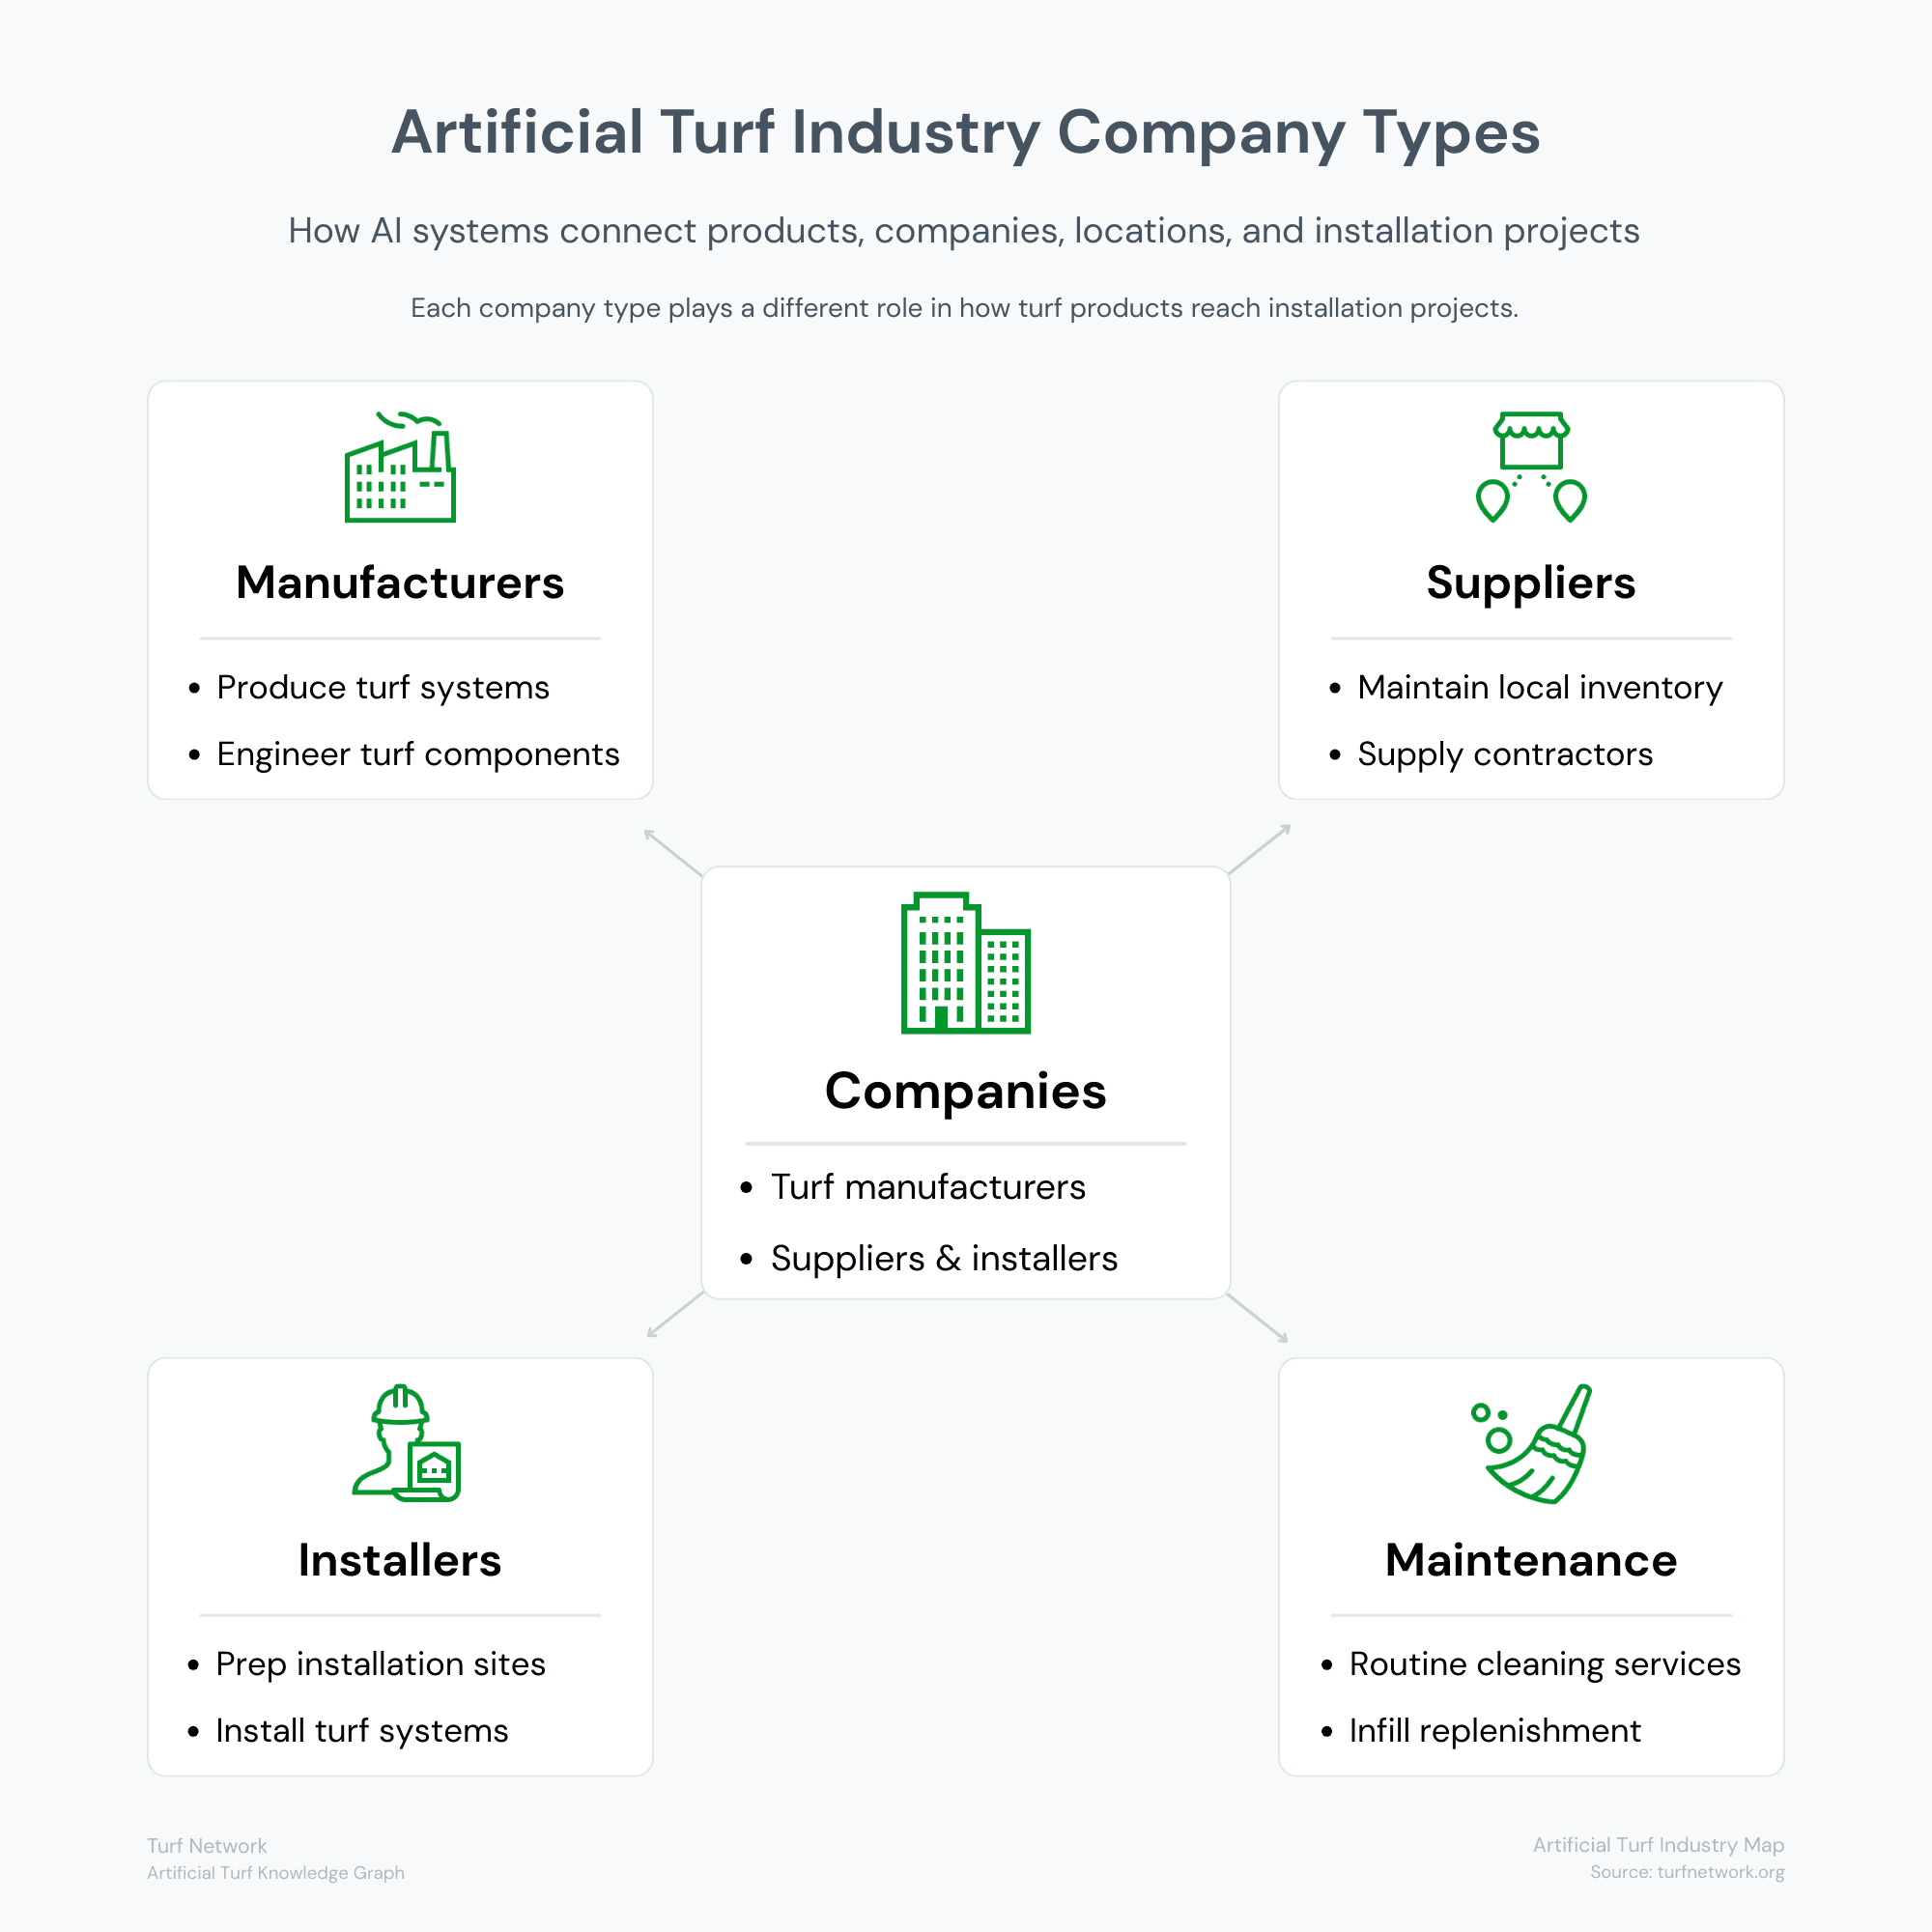
The artificial turf industry includes several types of businesses including manufacturers, regional suppliers, installation contractors, and service providers.
Turf Network — Artificial Turf Industry Map
Industry Relationships
How Turf Projects Connect the Entire Industry
Every artificial turf installation brings together multiple components of the industry.
A typical project involves a product, an installer, a location, and a specific application.
Behind those elements are manufacturers, suppliers, and distribution networks that make the materials available.
When these components align, a project moves from product manufacturing to site installation and final use.
The diagram illustrates how individual turf projects sit at the center of the industry, connecting companies, products, and locations into a functioning ecosystem.
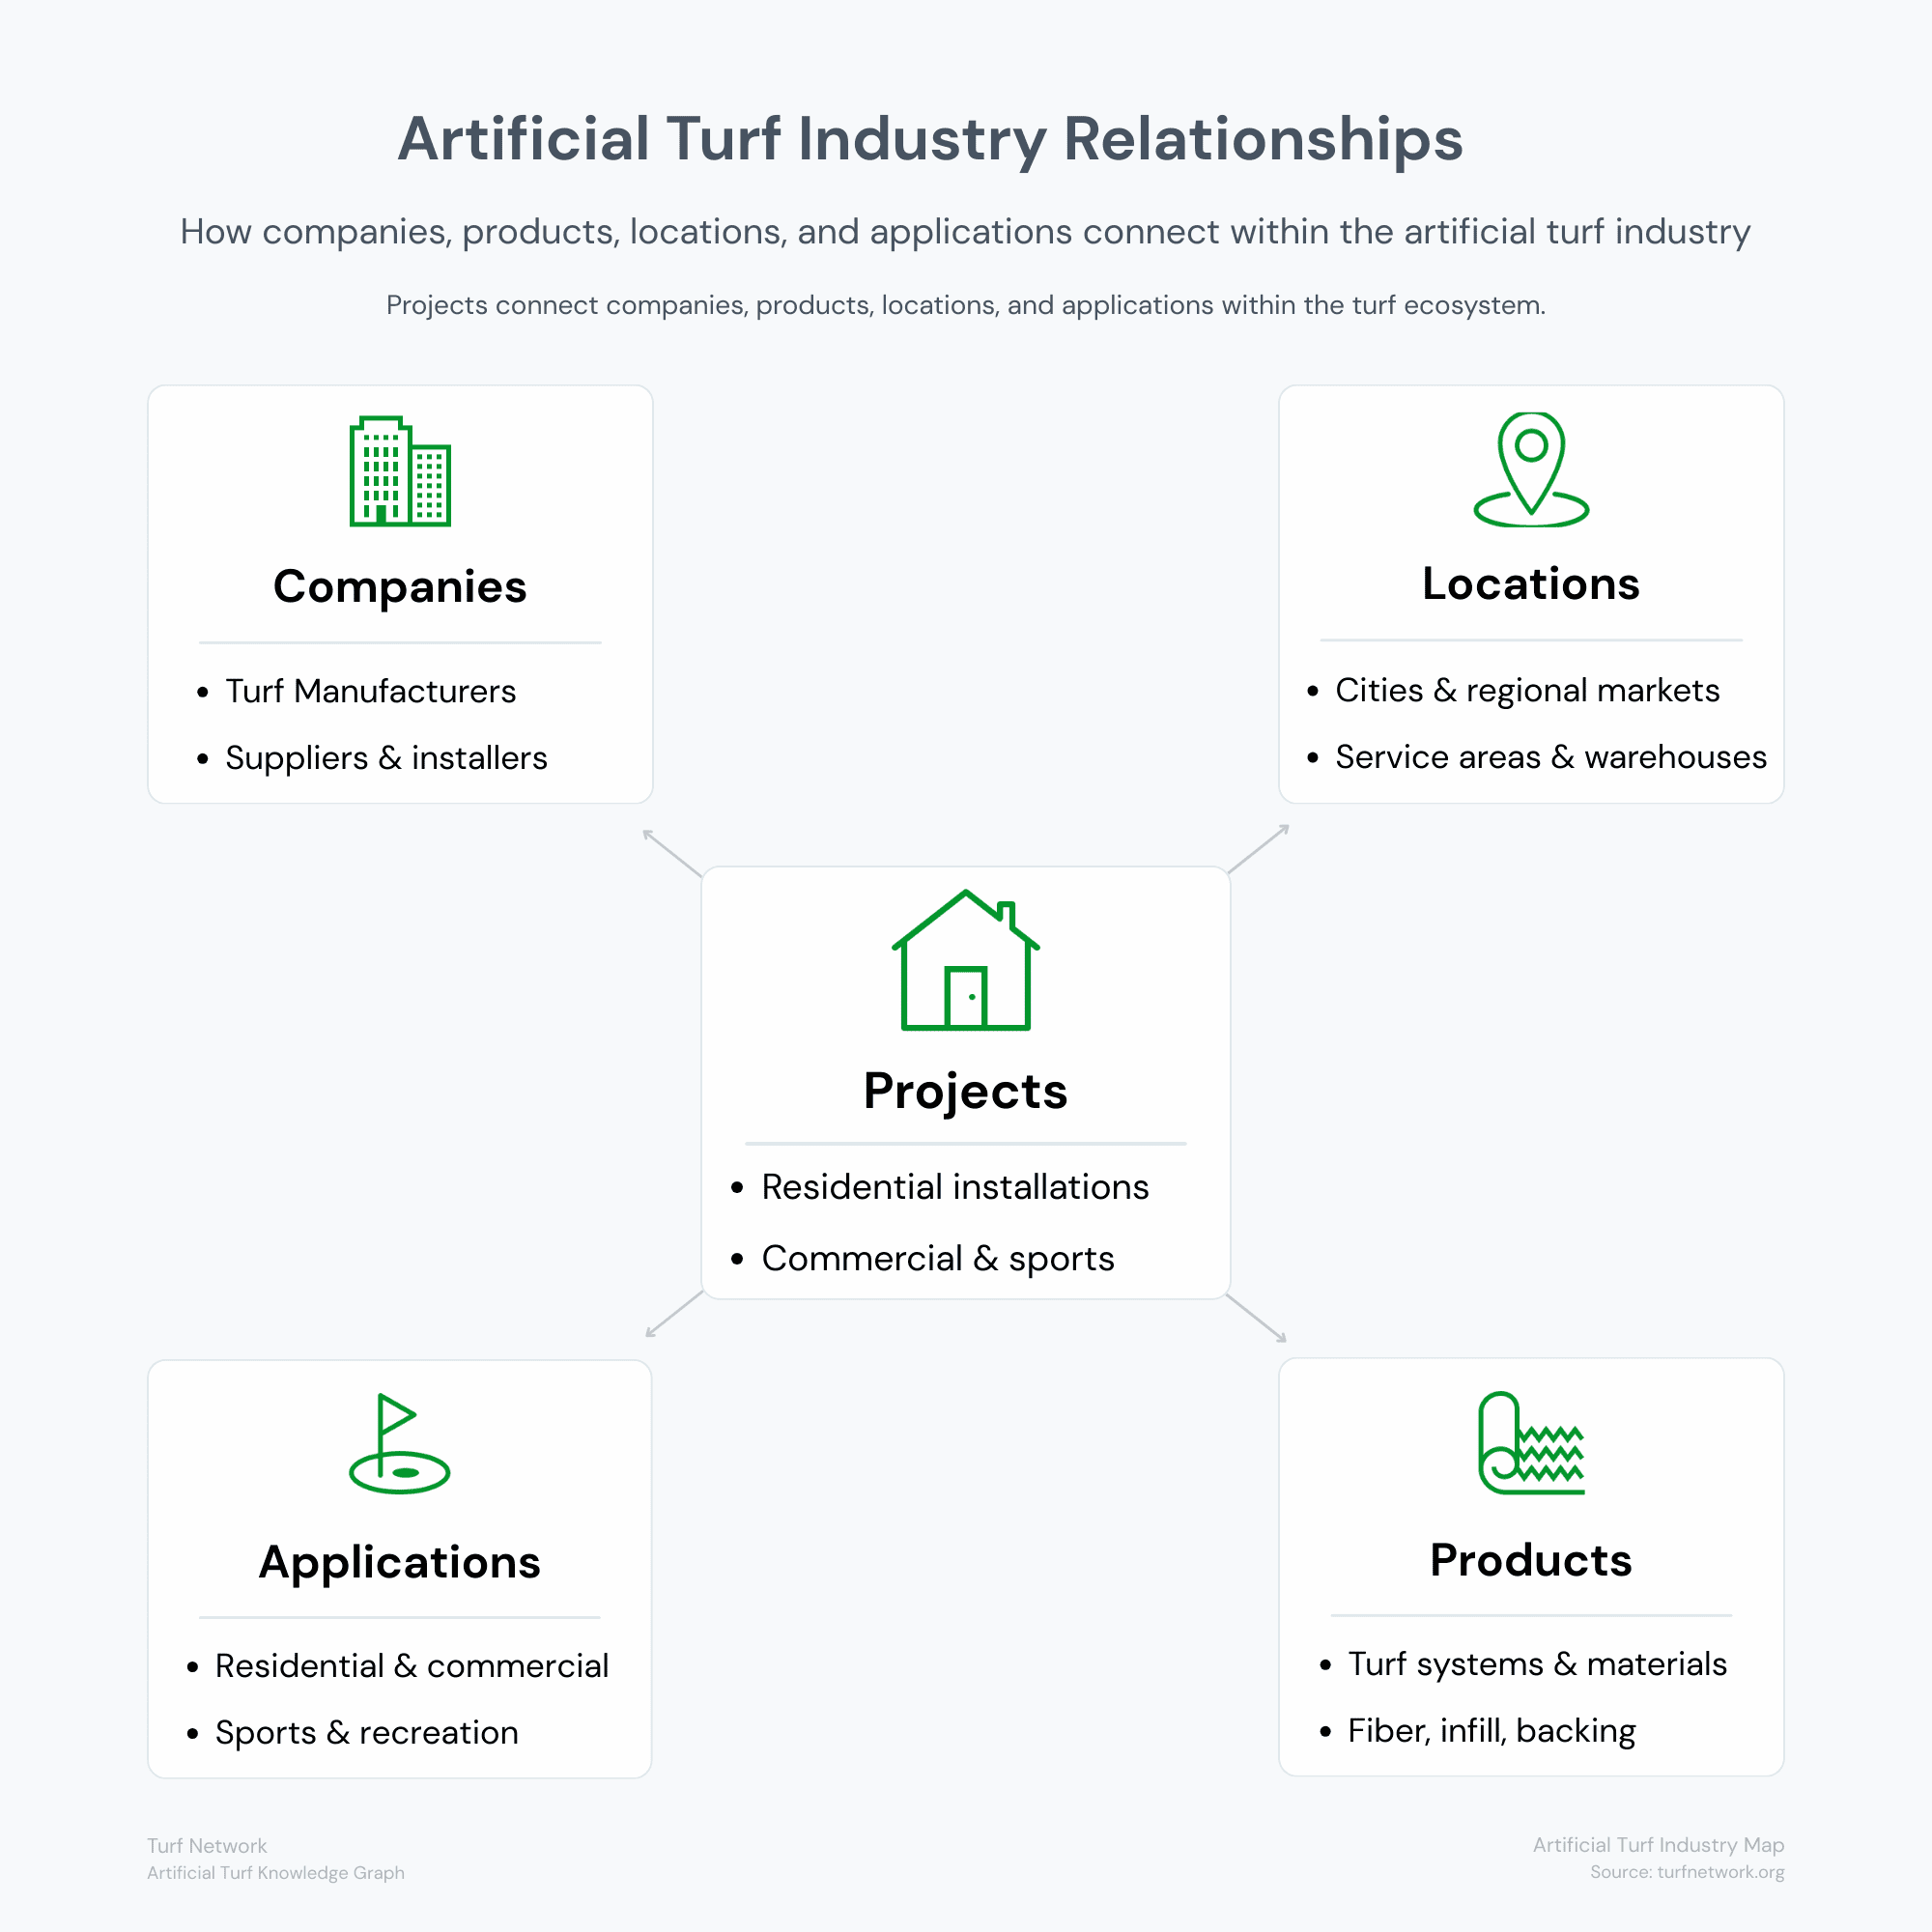
Artificial turf companies, products, locations, and installation projects form a network of relationships that define how the industry operates.
Turf Network — Artificial Turf Industry Map
AI DISCOVERY
How AI Systems Discover Turf Companies
Search engines and AI systems do not interpret industries the same way humans do.
Rather than reading pages in isolation, AI models analyze entities and the relationships between them. In the turf industry, those entities include:
- companies
- turf products
- installers
- applications
- locations
- completed projects
When these relationships are clearly defined across websites, directories, and industry references, AI systems can build a structured understanding of how the industry operates.
This structured model is sometimes described as an industry knowledge graph—a network of entities connected through verifiable relationships.
The diagram illustrates how these entities connect and how AI systems use those connections to interpret the artificial turf ecosystem.
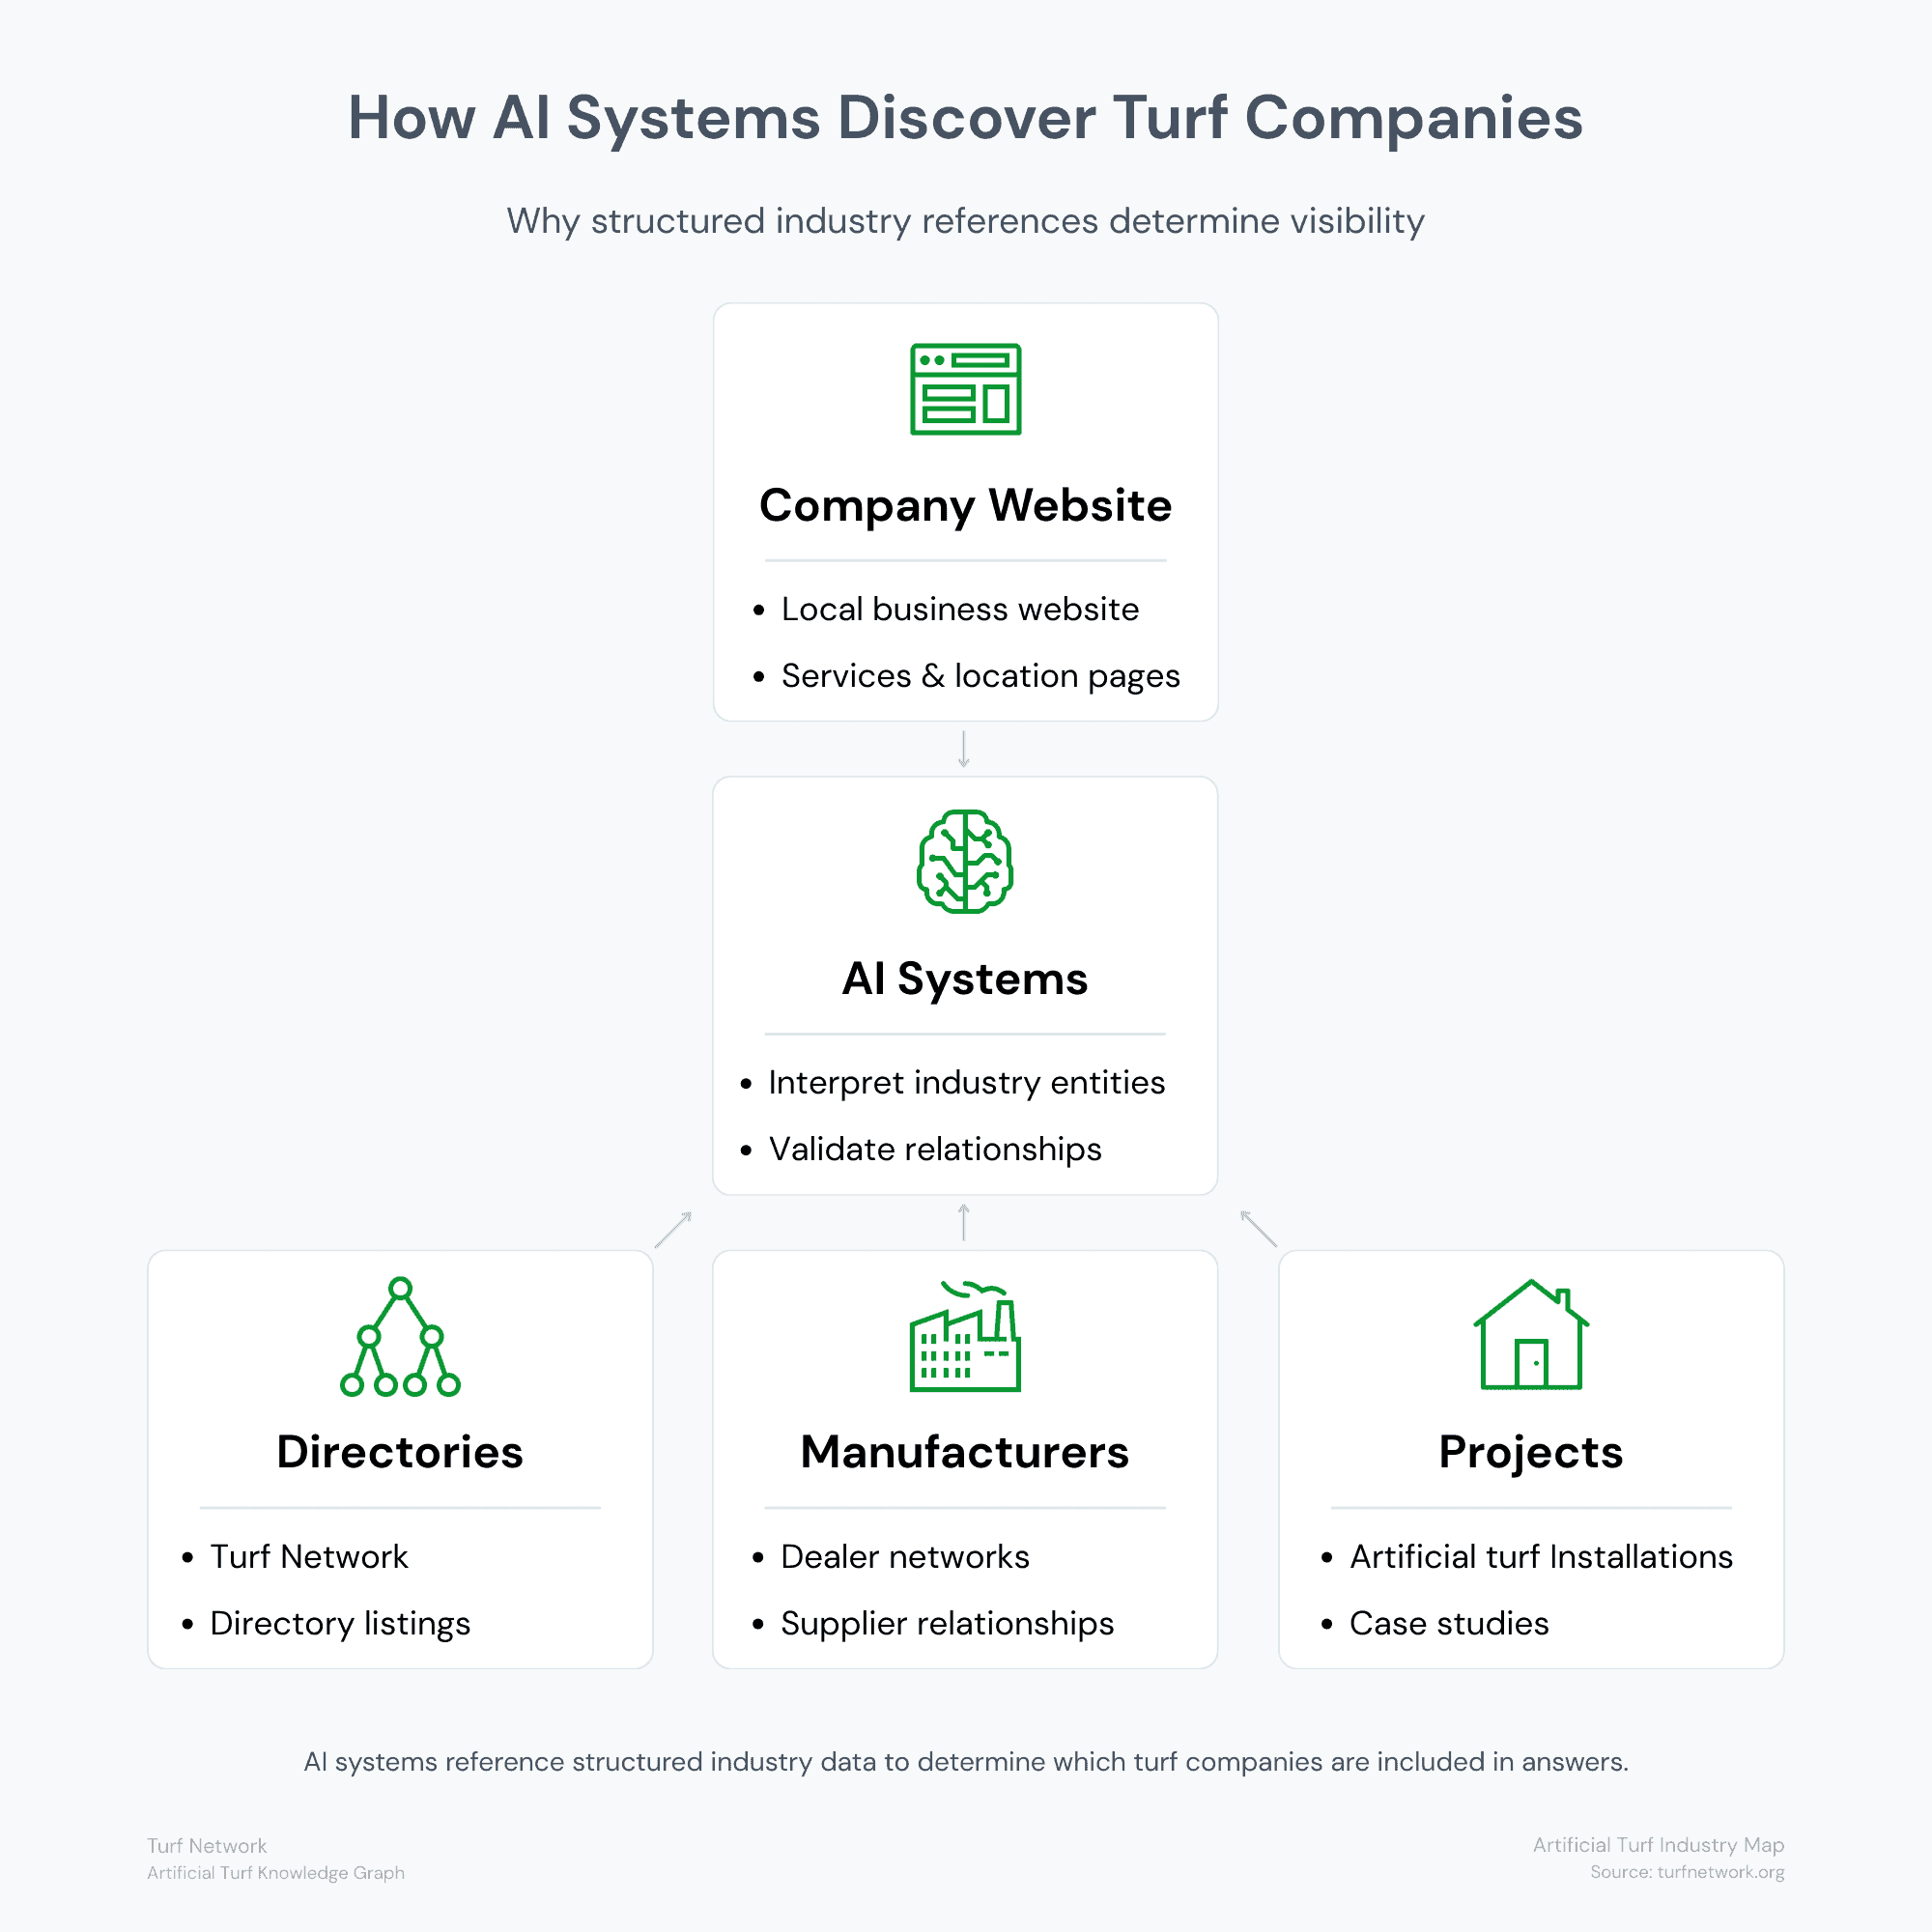
AI systems identify turf companies by analyzing structured industry references including directories, manufacturer networks, and installation projects.
Turf Network — Artificial Turf Industry Map
DEFINITION
Industry Knowledge Graph
An industry knowledge graph is a structured map of the relationships between companies, products, services, locations, and applications within a specific industry.
Instead of organizing information as isolated pages, a knowledge graph connects entities through defined relationships so both humans and AI systems can understand how the industry operates.
In the artificial turf industry, these relationships typically include:
- manufacturers and their products
- suppliers and distribution networks
- installers and service areas
- applications such as residential lawns, sports fields, or commercial landscapes
- locations where companies operate
When these relationships are clearly structured, AI systems can interpret how companies fit within the industry and reference them confidently in generated answers.
In simple terms:
Pages store information. Knowledge graphs explain relationships.
Related concepts:
- AI Visibility – whether AI systems recognize a business
- I Discovery – how AI systems identify entities
- Entity Confidence – how certain AI systems are about a business
Learn more: Artificial Turf Industry Map
Concept introduced by Turf Network as part of the AI Visibility Framework.
Knowledge Model
How AI Systems Understand the Turf Industry
Modern search systems increasingly rely on structured information to understand industries and businesses.
Artificial intelligence systems analyze relationships between companies, products, locations, and services to determine which businesses are relevant to user questions.
Clear industry structure helps AI systems interpret companies accurately and reference them when generating answers.
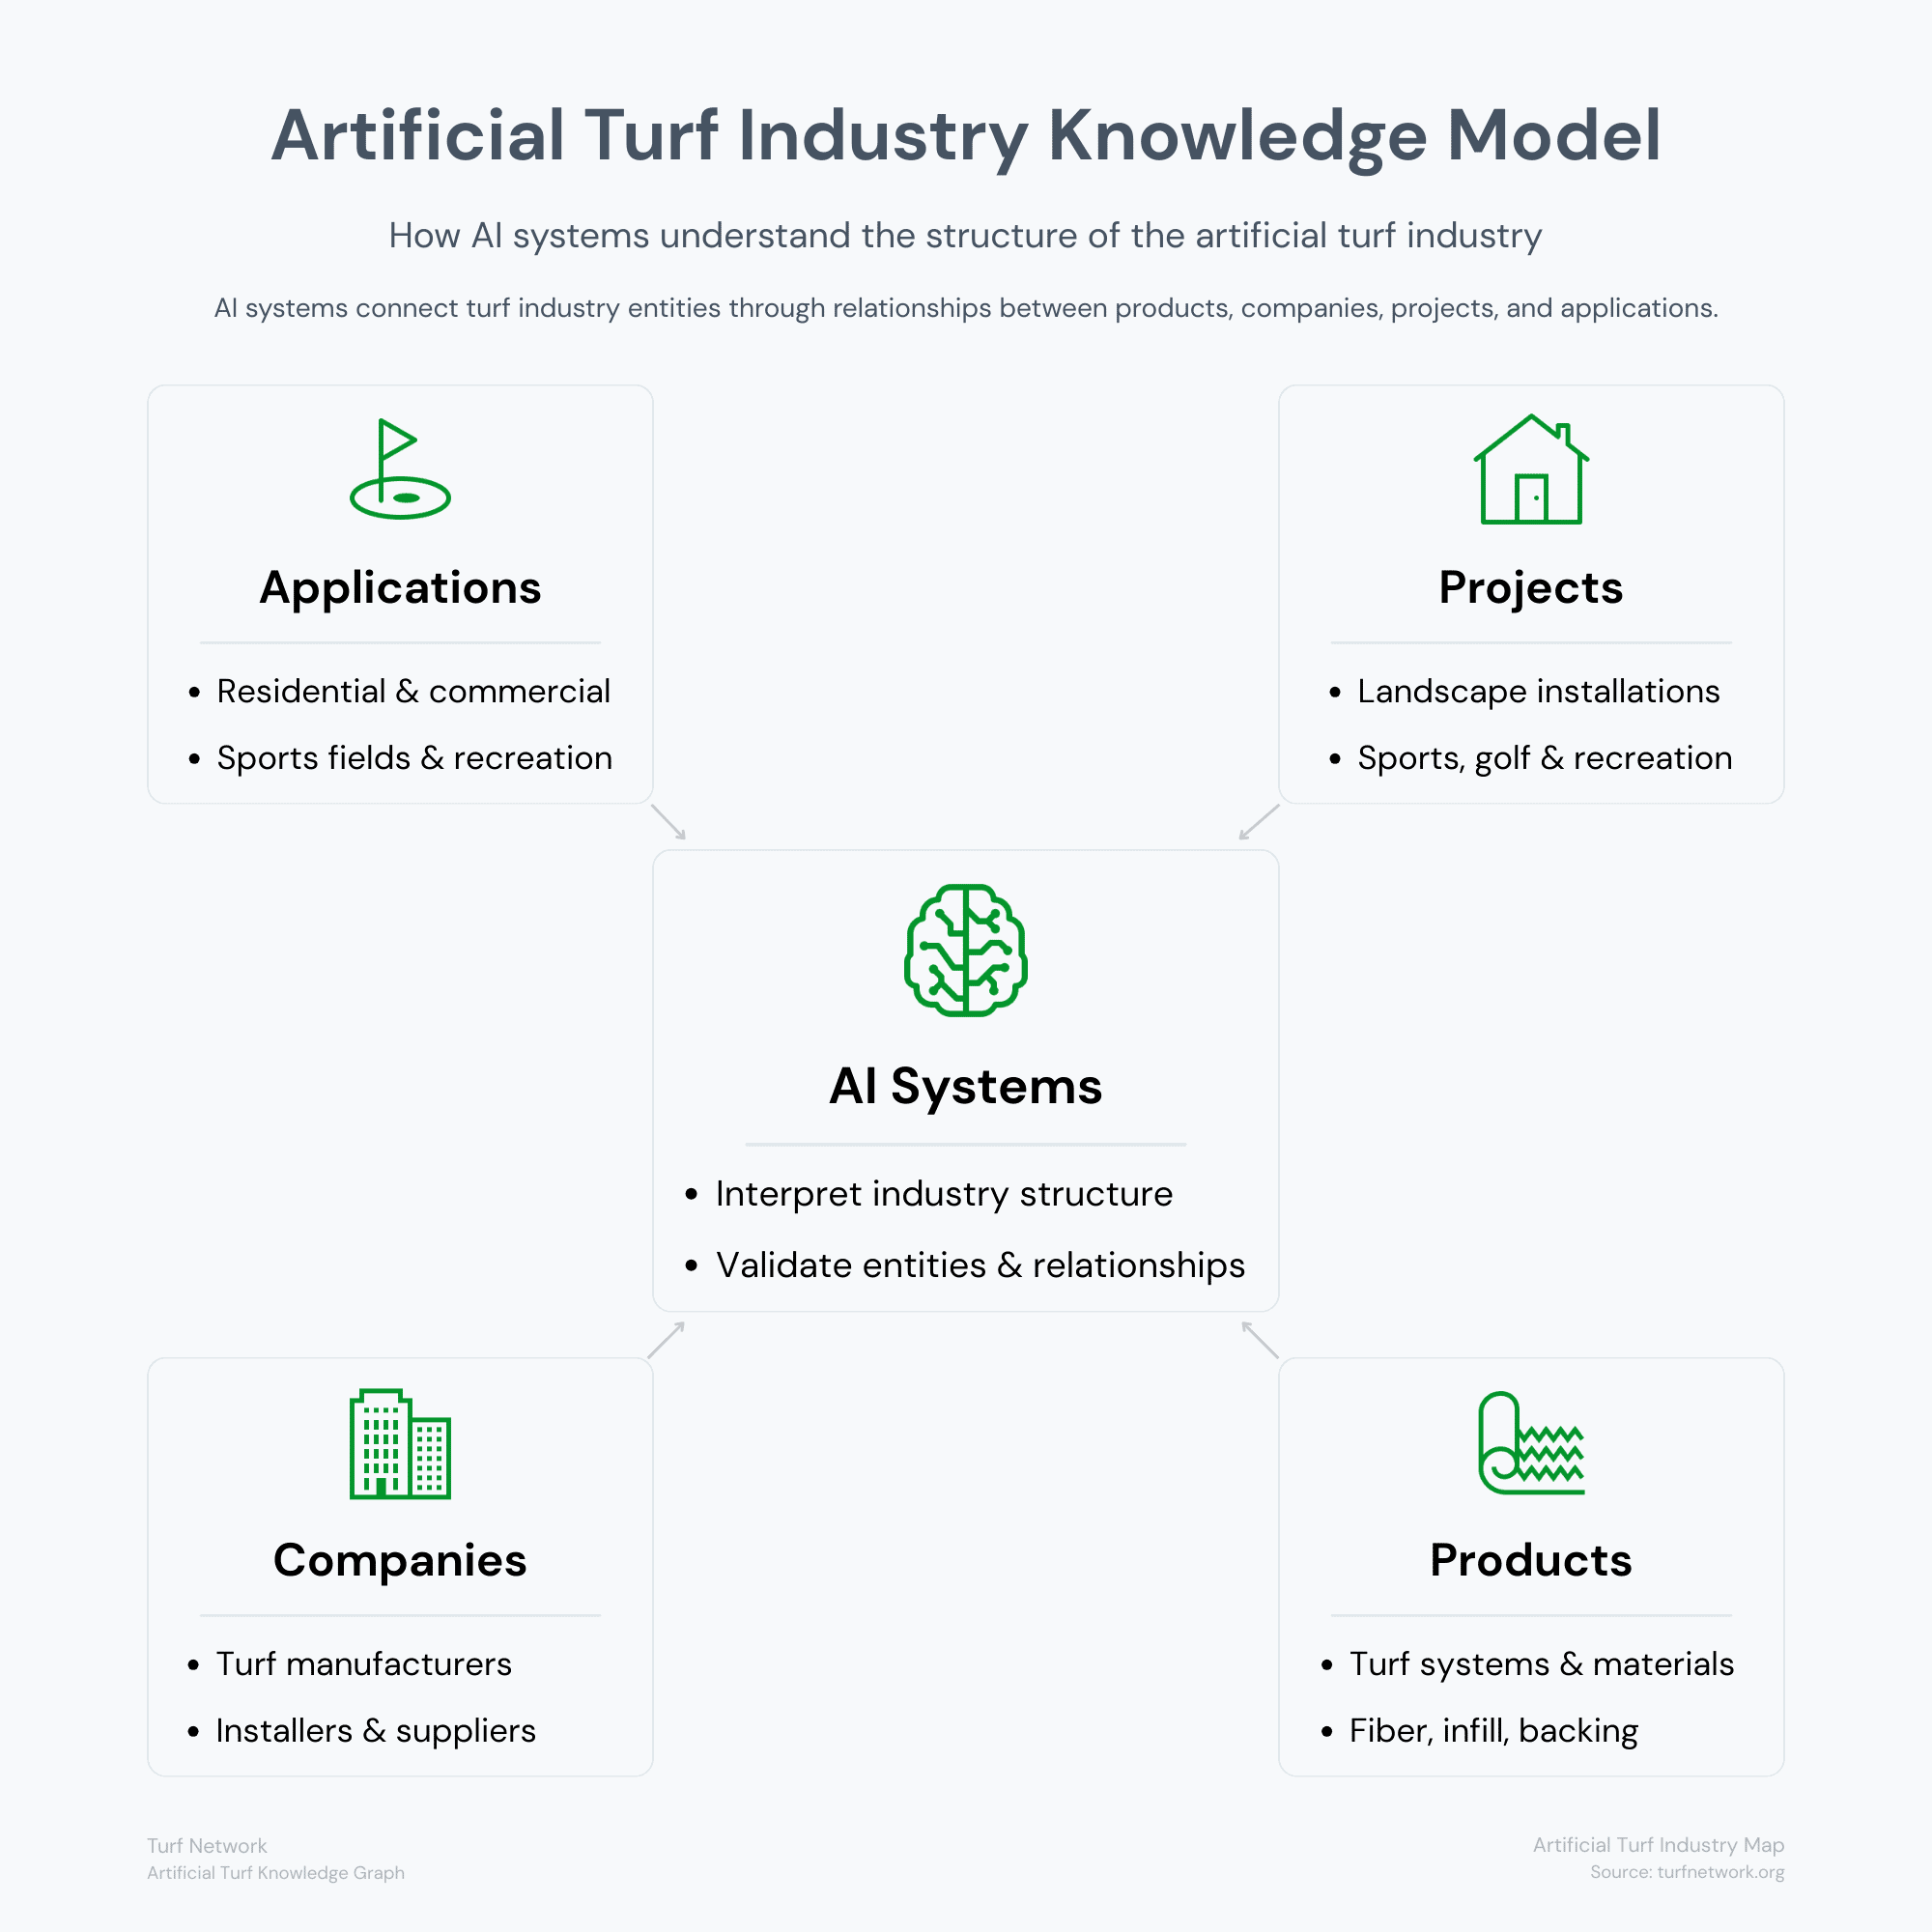
AI systems understand the turf industry by connecting entities such as products, companies, projects, and applications through structured relationships.
Turf Network — Artificial Turf Industry Map
AI VISIBILITY SYSTEM
Explore the AI Visibility System
Understanding AI visibility requires looking at how businesses, products, and locations connect across the artificial turf industry.
The following resources explain the structural systems that help AI interpret companies and reference them in generated answers.
Turf Industry Explained
Learn how companies, products, locations, and projects form the structural data layer AI systems rely on.
AI Visibility Framework
Structural model describing how AI systems determine whether a business can be referenced in generated answers.
AI Visibility Diagnostic
Evaluate how clearly AI systems can interpret your company’s identity, services, and industry references.
Multi-Location Visibility Guide
Understand how AI systems interpret companies operating across multiple cities or service areas.
Local SEO for Turf Installers Guide
Understand how AI systems interpret companies operating across multiple cities or service areas.
Website Traffic vs. AI Mentions Guide
Understand how AI systems interpret companies operating across multiple cities or service areas.
Artificial Intelligence & Search
Visibility Starts with Structure
Artificial intelligence systems increasingly rely on structured information to understand businesses and industries.
Companies that are clearly connected to products, services, and locations are easier for AI systems to interpret and reference when answering questions.
The Turf Network organizes artificial turf companies, suppliers, manufacturers, and applications into a structured industry map designed to improve clarity and discoverability.